Reproducibility in engineering work doesn’t seem to get the attention that it deserves. I can’t count the number of times that I’ve read an old engineering report in search of a particular result, only to find that the calculation that lead to that result is only barely described, or there is just a screenshot of an Excel workbook with a few input numbers and a final result. When I find things like this, it makes me a little nervous: did the original author use the correct formula when computing this result? What assumptions did the author make and neglect to document? What approximations were made? Was the original review of the report diligent enough to check this particular result?
Let’s take a hypothetical example. For simplicity, let’s assume that we’re analyzing some sort of bracket. It’s 2 inches wide, 0.125 inches thick and 5 inches long. It’s cantilievered with a load applied 2 inches from the free edge. We care about both the deflection and the maximum stress. The formulae for deflection and stress are given by Roark1. We’ll adapt those equations slightly:
Given these equations and the data above, we could quite easily do the calculation in an spreadsheet program like MS-Excel. But, if we want to include our calculation in a report (most likely as a screenshot of the spreadsheet), our report will probably just look like this:
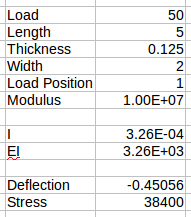
This shows the “right” answer, but if you’re reviewing the report, how do you know that the answer is right? If you’re reviewing the report before it’s released, you can probably get a copy of the Excel file and check the formulae in the cells. You’ll spend a few minutes deciphering the formula to figure out if it’s correct. But, if you’re reading the report later, especially if you’re outside the company that wrote it, good luck. You’re going to have to get out a pen, paper and your calculator to repeat the calculation and figure out if it’s right. This problem is even worse if the author of the report hard coded in a few of the input values (i.e. length, width, elastic modulus, etc.) into the formulae.
There are a few ways to address this problem of reproducibility. We’ll explore two of these ways. The first is to use software like MathCAD, or it’s free alternative SMath-Studio. Both of these products are WYSIWYG math editors that are unit aware. With either of these, your could do your calculations in the MathCAD or SMath-Studio and paste a screenshot of this into your report.
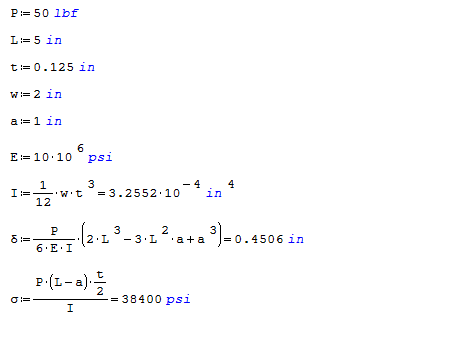
Now, the input data and the formula would be shown directly in the report. The added benefit is that, since these pieces of software are unit aware, you can’t make simple unit errors —- if you forget an exponent, the units shown in the result won’t be what you expect, so you know that you’ve made a mistake.
The other way to approach this problem is to use something called a notebook. If you’re comfortable enough to write simple code in Python, you could use a jupyter notebook. If you’re doing some data analysis or statistics, you might prefer to write some code in R (though, you could use pandas if you prefer to use Python). While you use R with jupyter notebooks (as well as several other languages), in my opionion R Studio’s R Notebooks are a little bit better to work with. If you were to do the same calculation with a notebook (in this case, we’ll use a jupyter notebook and Python), it would look like this:
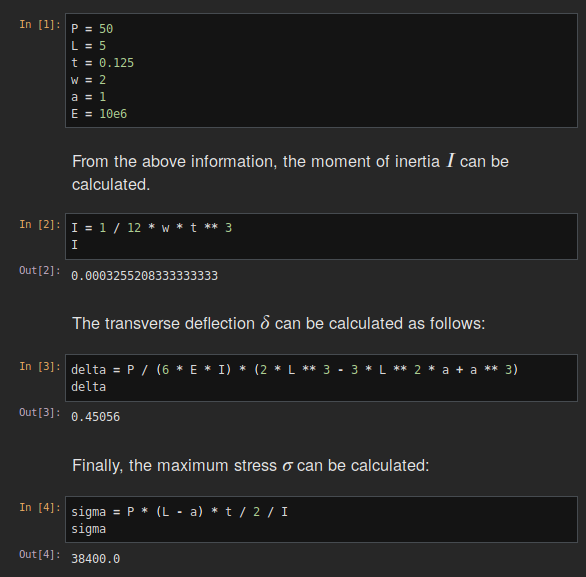
There are a few advantages of using a notebook. First, you can use a programming language with a little bit more power than MathCAD or SMath-Studio — if you need to do an iterative calculation or find the root of system of non-linear equations, you can do it with a language like Python or R — and do so in a way that’s not too difficult for the reader to understand. The other advantage of using a notebook is that notebooks are intended to mix code, results and text. You could actually write your whole report using a notebook! You could explain your approach to solving the problem, include the code used to solve the problem and then show the results all in the same document. No need to copy-and-paste anything and no need to store multiple files (like a word document and a SMath-Studio file).
Text written in a notebook (either a jupyter notebook or an R Notebook) is written using using something called markdown. This is a “lightweight” way of formatting text. If you want a bullet list, you just type an asterix at the beginning of each line; if you want a heading, you start the line with a hash symbol (or two for a sub-heading). And, most importantly for engineering reports, you can include formulae using LaTeX from within markdown just by enclosing the formula with two dollar signs before and after it — no need to suffer through using the MS-Word Equation Editor.
If you need a corporate format for your report, there are ways to create PDFs from either a jupyter notebook or an R Notebook using a custom format. I plan on writting about this in a later post. Stay tuned. (Edit: I’ve written about this here)
We’ve explored a few ways of making an engineering report more reproducible. Neither of the solutions explored are idea for every scenario — some scenarios are more suited to one of the solutions or the other — but both will improve many engineering reports.
-
W. Young and R. Budynas, Roark’s Formulas for Stress and Strain, Seventh Edition. New York: McGraw-Hill, 2002. ↩